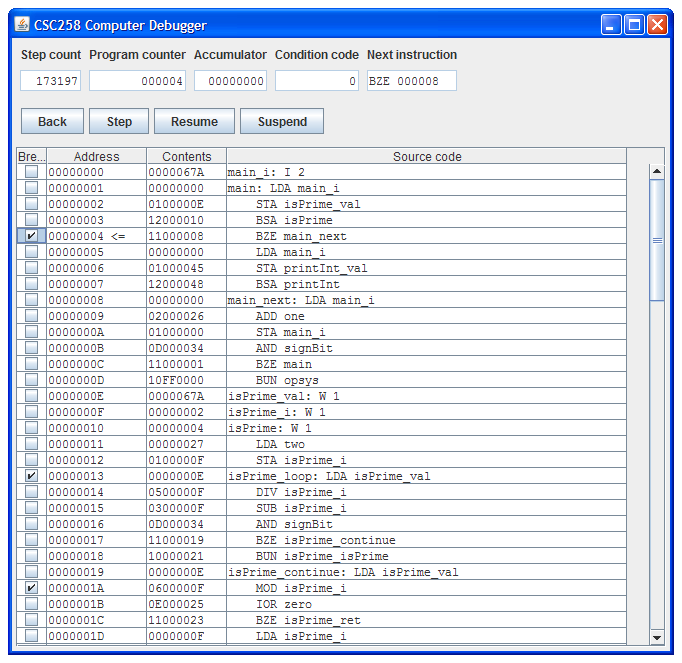
 CSC258 computer debugger
Introduction
The CSC258 computer is a hypothetical machine used for teaching assembly language to students. The machine specification was created by Eric C.R. Hehner at the University of Toronto for the CSC258H course.
The machine consists of a basic CPU, an address space for RAM, and byte-based I/O devices. The CPU has an accumulator register, a status flag register, and an instruction pointer register. The CPU operates on a reasonably small instruction set.
Officially, an assembly language is defined for the instruction set, but the binary machine code is not defined. Also, Eric Hehner provides an official C interpreter that parses and runs a CSC258 assembly language program.
My contributions to the CSC258 computer ecosystem are a set of Java-based tools (especially a graphical debugger) and numerous sample programs. These programs were developed from scratch by me in year , and are open source (see the project license).
Note: The CSC258 CPU’s instruction set is reminiscent of old computers such as the Little man computer, PDP-8, and MOS Technology 6502.
Source code 
Project repository at GitHub: https://github.com/nayuki/CSC258-computer-debugger
Features
User features:
- Command-line runner (
csc258comp.runner.Runner) - Graphical debugger (Swing UI) (
csc258comp.debugger.Debugger)- State of registers
- Execution step, backward-step, run, suspend
- Breakpoints
- Source code
- Current instruction
- Memory contents
- Meaningful error messages from the compiler
- Sample CSC258 programs (in the demo directory)
Developer features:
- Clean code, easily modifiable and extensible
- Code guards against null pointers, out-of-bounds, illegal input parameters, and other misuses of the API in a fail-fast way
- Some functionality is covered by JUnit tests
- Compilation of CSC258 programs is separated from linking
Building
Run javac on every .java file. Or better yet, import the project into an IDE like Eclipse or NetBeans.
On Unix, you can also perform these commands in a shell:
cd /...csc258-project-dir.../
mkdir bin
javac -d bin $(find src -name "*.java" -print)
Running
You must set the working directory or the class path to the appropriate root for Java class files. For example, if the runner is located at /...csc258-project-dir.../csc258comp/runner/Csc258Runner.class, then you must do one of these (just one):
-
cd /...csc258-project-dir.../
java csc258comp.runner.Runner[CSC258 files] -
java -cp /...csc258-project-dir.../ csc258comp.runner.Runner[CSC258 files] -
export CLASSPATH=/...csc258-project-dir.../
java csc258comp.runner.Runner[CSC258 files]
Examples:
java csc258comp.runner.Runner demo/helloworld.258.txtjava csc258comp.debugger.Debugger demo/primes.258.txt demo/lib/const.258.txt demo/lib/printInt.258.txt
Graphical debugger guide
Registers view
At the top, there is a row of text boxes showing the states of all the machine registers, plus some other information.
Step count: The number of instructions executed at the current state. When the machine has just started, the value is 0.
Program counter: The program counter, a 24-bit value, displayed in hexadecimal.
Accumulator: The accumulator register, a 32-bit value, displayed in unsigned hexadecimal.
Condition code: The condition code, a Boolean value.
Next instruction: The value of the memory at the program counter location, interpreted as an instruction. The top 8 bits are used to look up the opcode’s mnemonic, and the bottom 24 bits are a memory reference, displayed in hexadecimal. If the opcode is illegal, this is indicated. If the machine has halted, this is also shown here.
When stepping or back-stepping, the background color of the register text boxes may be highlighted in yellow. For the accumulator and condition code, they are highlighted if their values change. For the program counter, it is highlighted if it changes to any value other than the next higher number; this is useful for detecting branches.
When resuming, running, and suspending, the background color of the register text boxes revert to being unhighlighted.
The values of registers cannot be changed using this view.
Memory view
The big table on the lower part of the window is the memory view. Each row of the table shows information about a word of memory:
Whether an instruction breakpoint is enabled or not.
The memory address, a 24-bit value, displayed in hexadecimal.
The contents of the memory word, a 32-bit value, displayed in unsigned hexadecimal.
The source code line associated with the memory address, if any.
The memory view only shows memory addresses in the program’s compiled image’s range. If the program causes the machine to jump or write to a memory location outside of this region, the effect will happen normally, but the view cannot show it.
The contents of the memory cannot be changed using this view.
Execution actions
When the machine has just started, it has not executed any instructions, and it is currently suspended.
Step: Executes one instruction.
The machine remains suspended. Breakpoints have no effect. This action has no effect if the machine is running or if the machine has halted.Back: Restores the machine state from one instruction ago.
The machine remains suspended. Input is memoized, so re-executing anINPwill result in the same data being given to the machine. Output data is also memoized, so re-executing anOUTwill have its output suppressed. Breakpoints have no effect. This action has no effect if the machine is running.Resume: Resumes execution of the machine until a breakpoint is hit or the suspend button is pressed.
It is allowed to add and remove breakpoints when the machine is running. This action has no effect if the machine has halted.Suspend: Suspends execution of the machine.
This has no effect if the machine is already suspended.
When stepping, the registers view and the memory view update fully after each step action. When running, these views update many times a second.
When stepping over an I/O instruction (i.e. INP, OUT), the debugger GUI may freeze until the instruction has completed.
Breakpoints
In the first column of the memory view table, there is a column of checkboxes. To set a breakpoint at a memory address, click on the checkbox. To remove a breakpoint, click the checkbox.
Breakpoints are used only when the machine is running. The machine is run by pressing the “Resume” button.
